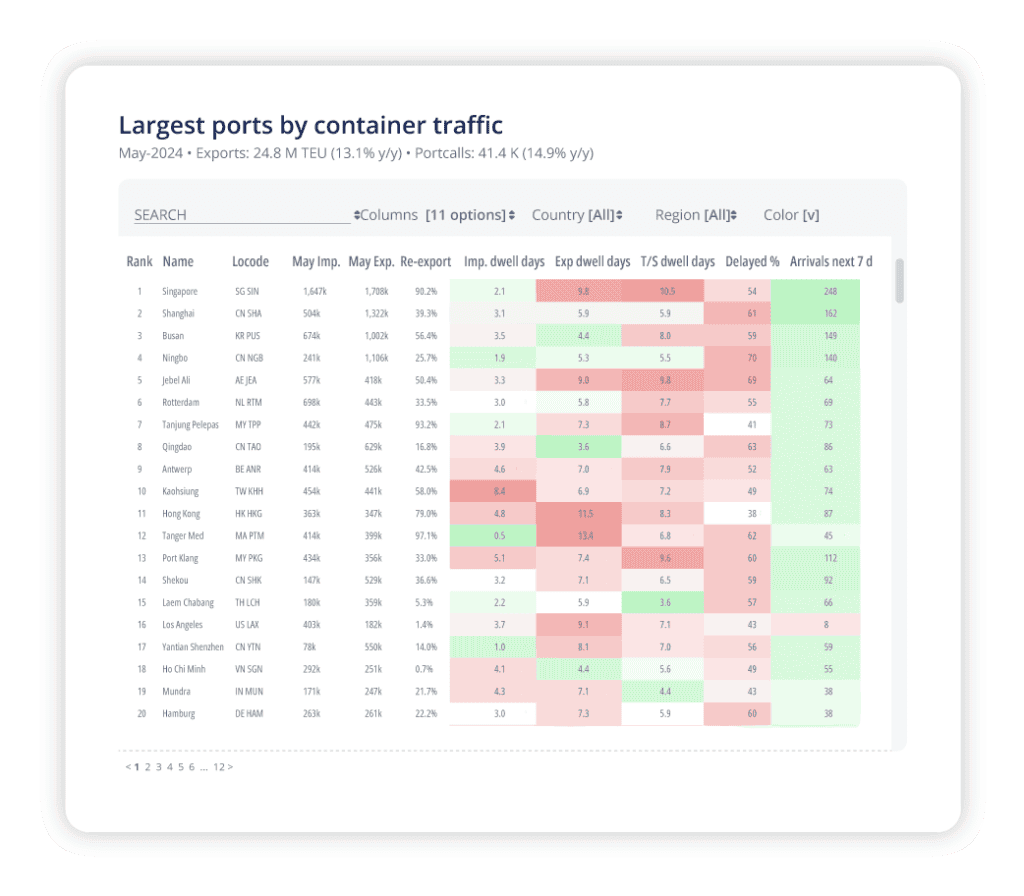
Port Name and Locode
Each port is listed by name along with its Locode, an internationally recognized code used to identify ports and other locations in international trade. This helps users easily identify and reference specific ports.
Monthly Import and Export Volumes
The table displays the monthly import (May imp.) and export (May exports) volumes in thousands of TEUs (Twenty-Foot Equivalent Units), providing a clear picture of the trade flow through each port. This information is crucial for businesses planning their logistics and supply chain operations.
Re-export Percentage
The re-export percentage indicates the proportion of goods that are re-exported from the port after import. This metric is important for understanding the port’s role in global transshipment and re-export activities.
Import and Export Dwell Days
The columns for import dwell days (Imp. dwell days) and export dwell days (Exp. dwell days) show the average number of days containers stay at the port before being processed for import or export. This information helps in assessing the efficiency and congestion levels at each port.
Transshipment Dwell Days
T/S dwell days column represents the average time containers stay at the port during transshipment. It is a key metric for evaluating the efficiency of transshipment operations at the port.
Delayed Percentage
The delayed percentage (Delayed %) shows the proportion of shipments that experienced delays. This metric is vital for businesses to anticipate potential disruptions and plan accordingly.
Arrivals Next 7 Days
This column lists the number of expected vessel arrivals at the port in the next seven days, helping businesses forecast port activity and manage their supply chain schedules.
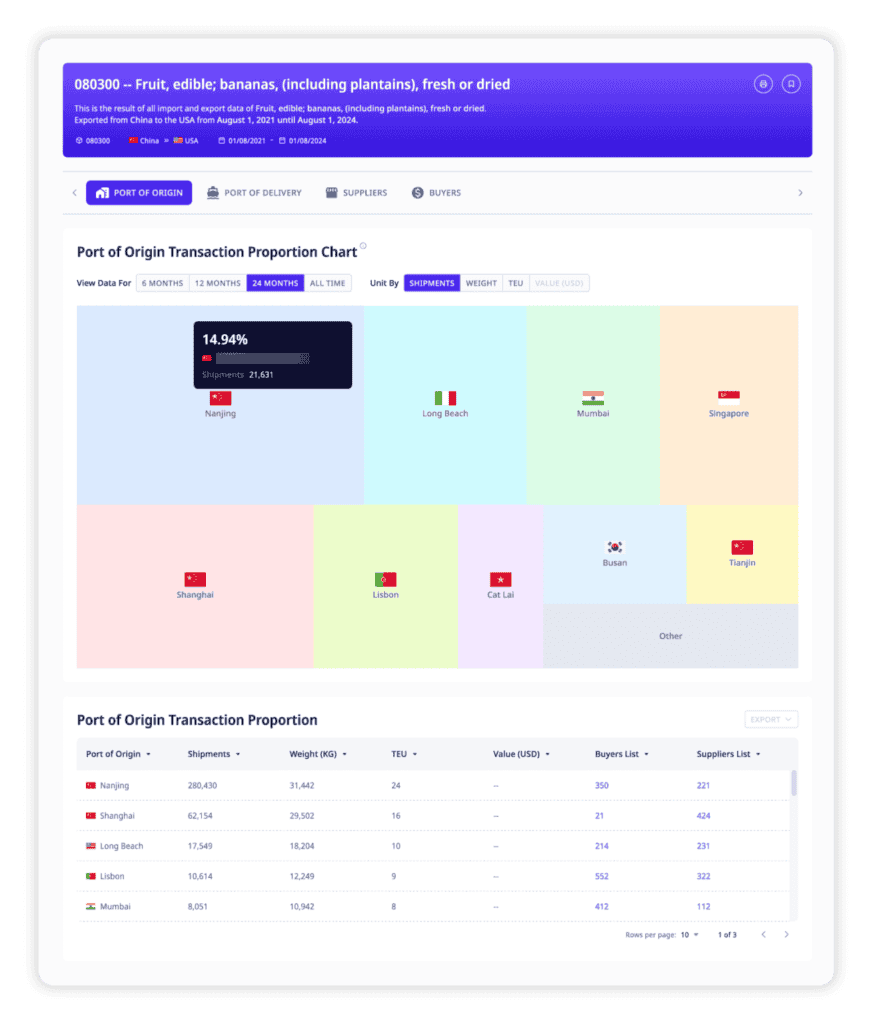
ADAMftd Global Port Trade Data Analysis Feature
The ADAMftd platform offers a powerful feature for analyzing port data specific to products by HS code or detailed product information. This tool allows users to view and interpret trade data through both ports of origin and ports of delivery. As illustrated in the image, users can access a comprehensive dashboard that visualizes the top ports of origin over various timeframes, with detailed insights into shipment volumes, weights, TEUs, and values. The interactive map and detailed tables enable users to pinpoint key trade hubs and assess their impact on global supply chains. This feature is crucial for businesses aiming to optimize logistics, identify market trends, and make data-driven decisions to enhance their international trade strategies.
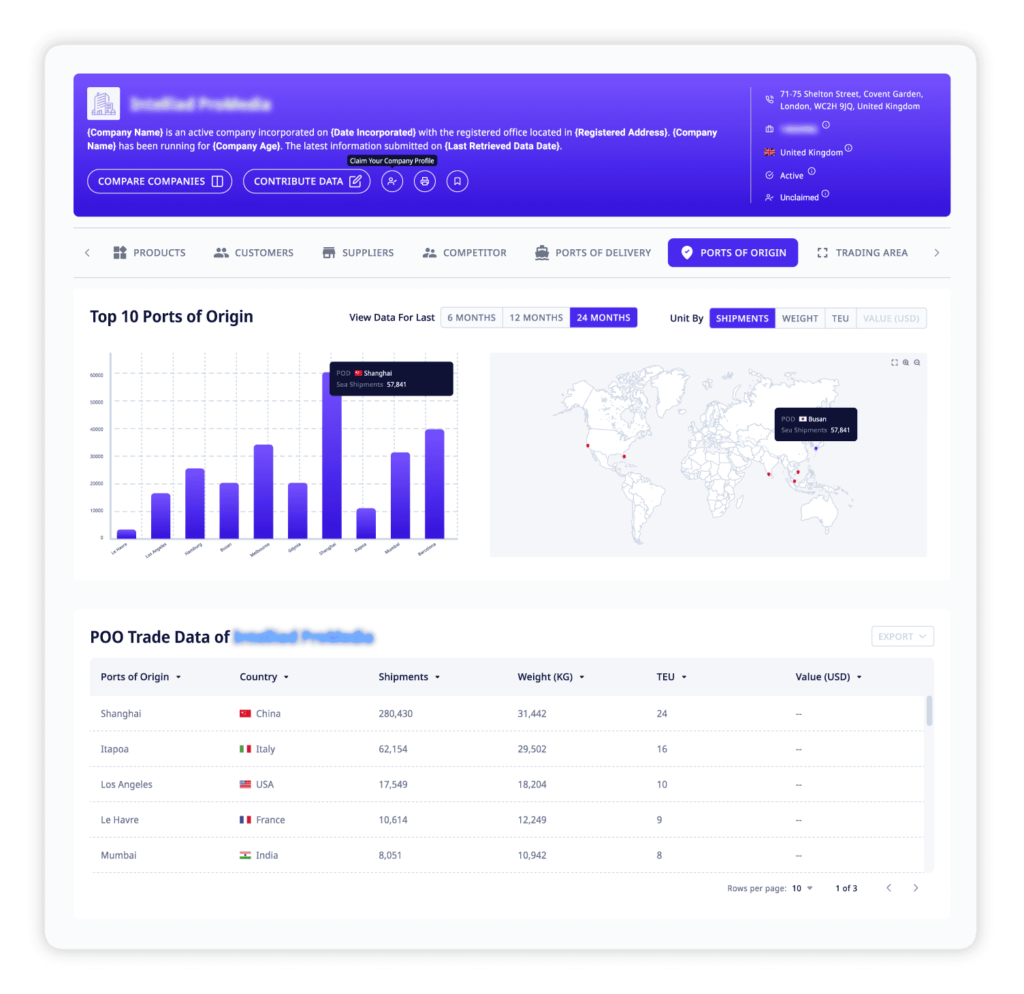
Company-Specific Port Trade Data Analysis Feature
The ADAMftd platform provides an essential feature for analyzing company-specific port data, focusing on both ports of origin and ports of destination. This tool allows users to gain insights into the logistics flows of competitors and suppliers, offering a strategic advantage in understanding trade patterns. The detailed dashboard, as shown in the image, displays the top ports of origin with metrics such as shipment volumes, weights, TEUs, and values over different time periods. The interactive map and data tables offer a comprehensive view of where shipments originate and where they are delivered, helping businesses optimize their supply chain, benchmark against competitors, and identify potential market opportunities. This feature is invaluable for strategic planning and enhancing competitive intelligence in international trade.
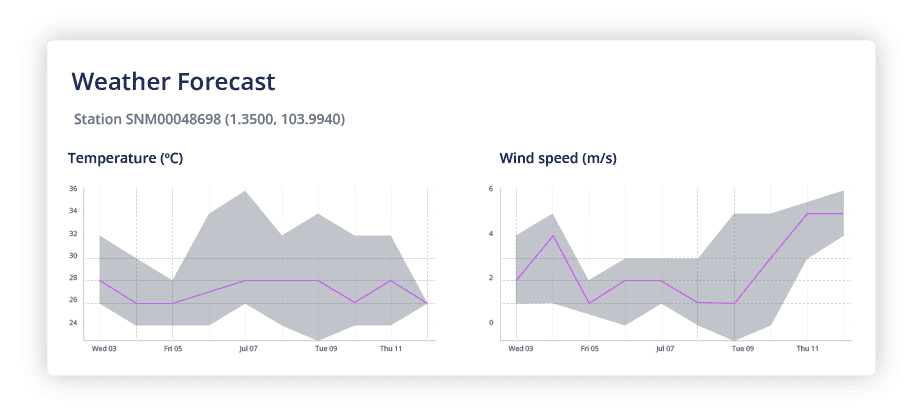
Accurate Weather Forecasting for Ports
ADAMftd provides detailed weather forecasting for ports, including critical metrics such as temperature and wind speed. This feature enables port operators and shipping companies to anticipate and prepare for weather conditions that could impact port operations and shipping schedules. By leveraging accurate and timely weather data, users can enhance operational planning, minimize disruptions, and ensure the safety and efficiency of maritime activities.
Comprehensive Analysis of Portcall Timeliness
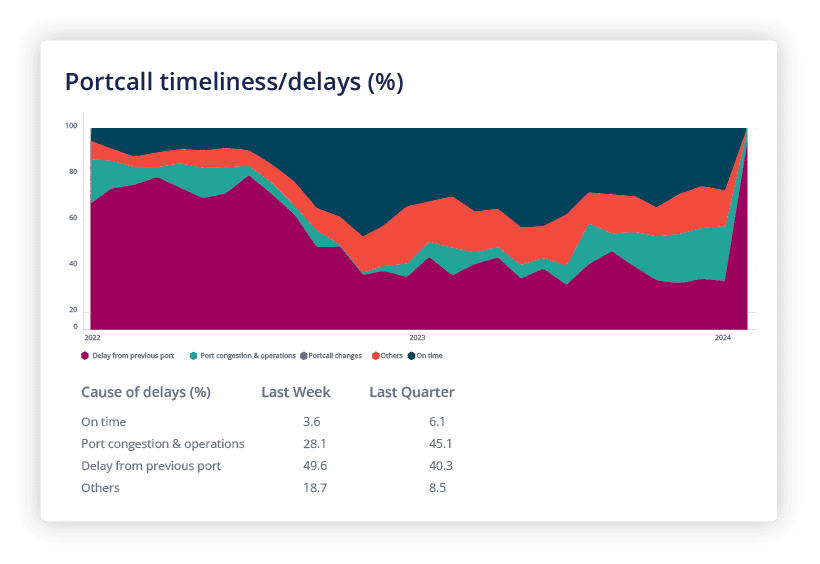
ADAMftd offers an in-depth analysis of portcall timeliness and delays, presenting data on various causes of delays, such as port congestion, operational issues, and delays from previous ports. This feature provides a clear understanding of port performance and helps identify bottlenecks that could affect shipping schedules. By utilizing this information, stakeholders can improve logistics planning, enhance supply chain efficiency, and mitigate risks associated with port operations.
Detailed Terminal Performance Metrics
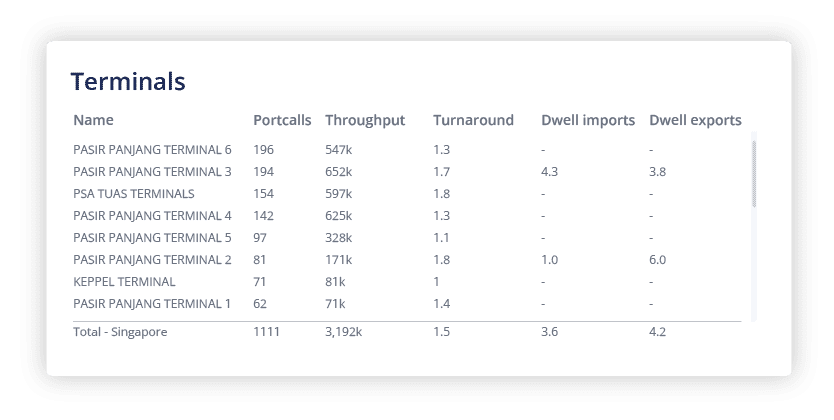
ADAMftd provides comprehensive data on port terminal performance, including metrics such as portcalls, throughput, turnaround times, and dwell times for imports and exports. This feature offers valuable insights into the operational efficiency of individual terminals, enabling users to make informed decisions about port usage and logistics planning. By analyzing terminal performance, businesses can optimize their supply chain operations, reduce waiting times, and enhance overall efficiency in cargo handling.
Industries
- Logistics and Transportation
- Freight Forwarding
- Ship Owners
- Customs Brokers
- Government Agencies
- Import/Export Trading
- Manufacturing
- Supply Chain Management
- Risk Management
- Infrastructure
- Foreign Direct Investment
Port Information Use Cases

Efficiently Planning Shipments
Monitoring port schedules allows businesses to plan their shipments more efficiently, ensuring timely loading and unloading of cargo. By having accurate schedule information, companies can minimize wait times and avoid costly delays, improving overall supply chain efficiency.

Selecting Reliable Port Services
Keeping track of port operators enables businesses to choose reliable and efficient services for their shipping needs. Understanding the capabilities and reputation of different operators helps in selecting those that offer the best service, ensuring smooth and efficient cargo handling.

Evaluating Port Handling Capabilities
Knowing the capacities of ports helps businesses assess whether a port can handle their cargo volume. This information is crucial for planning large shipments, avoiding congestion, and ensuring that the port can accommodate their logistical needs, thereby preventing delays and inefficiencies.

Budgeting for Port Services
Monitoring handling fees at different ports allows businesses to budget accurately for their shipping costs. By comparing fees, companies can choose cost-effective ports, optimize their logistics expenses, and improve their overall cost management.

Optimizing Cargo Handling
Access to detailed terminal information, including the types of cargo they handle and their specific services, helps businesses optimize their cargo handling processes. This ensures that cargo is processed at the most suitable terminal, enhancing efficiency and reducing the risk of damage.

