Product Market Analytics
ADAMftd’s Product Market Analytics offers unparalleled insights into the right markets for sourcing or selling any product. With the ability to drill down to individual companies, their suppliers, and customers, users can accurately gauge market share and competitive positioning. This tool provides a significant competitive advantage by enabling precise market targeting and efficient supply chain management.
Market Analytics
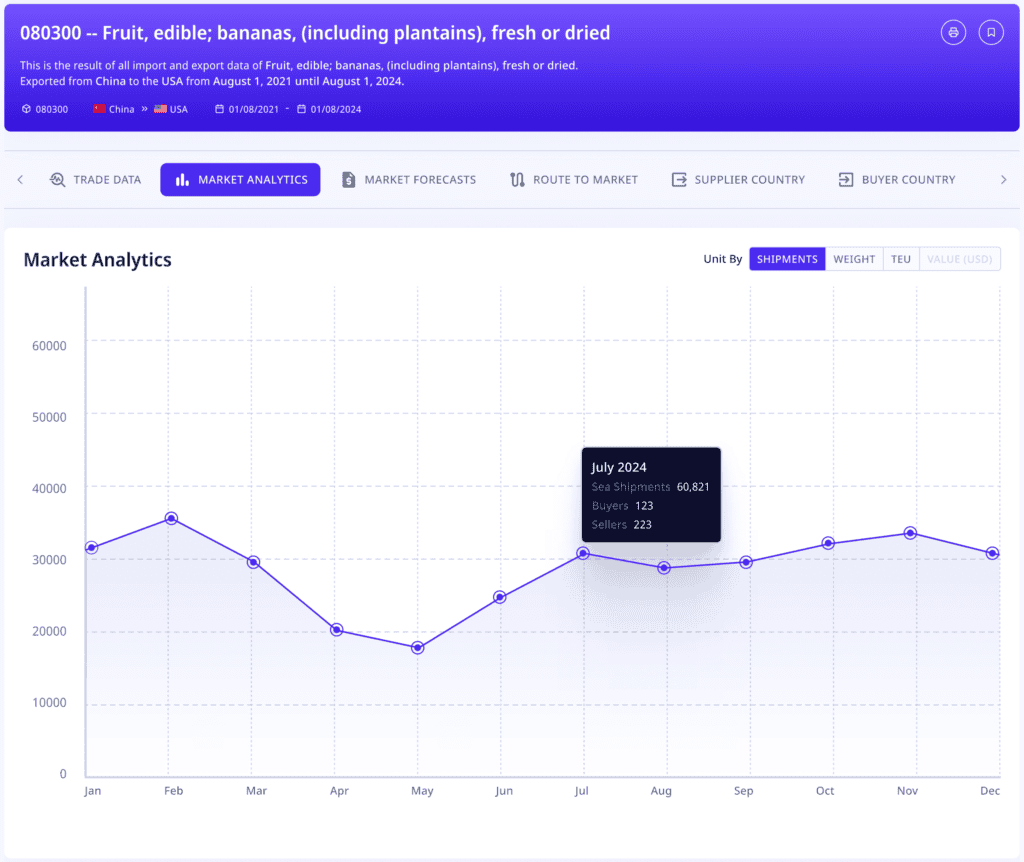
The Market Analytics screen provides a detailed overview of trade volumes and trends over time. Users can see shipment data, buyer and seller numbers, and weight metrics. This information allows businesses to track market dynamics, identify peak trading periods, and make data-driven decisions on when to enter or exit a market. The ability to analyze these trends helps companies optimize their strategies for both sourcing and selling products.
Suppliers Proportion Chart
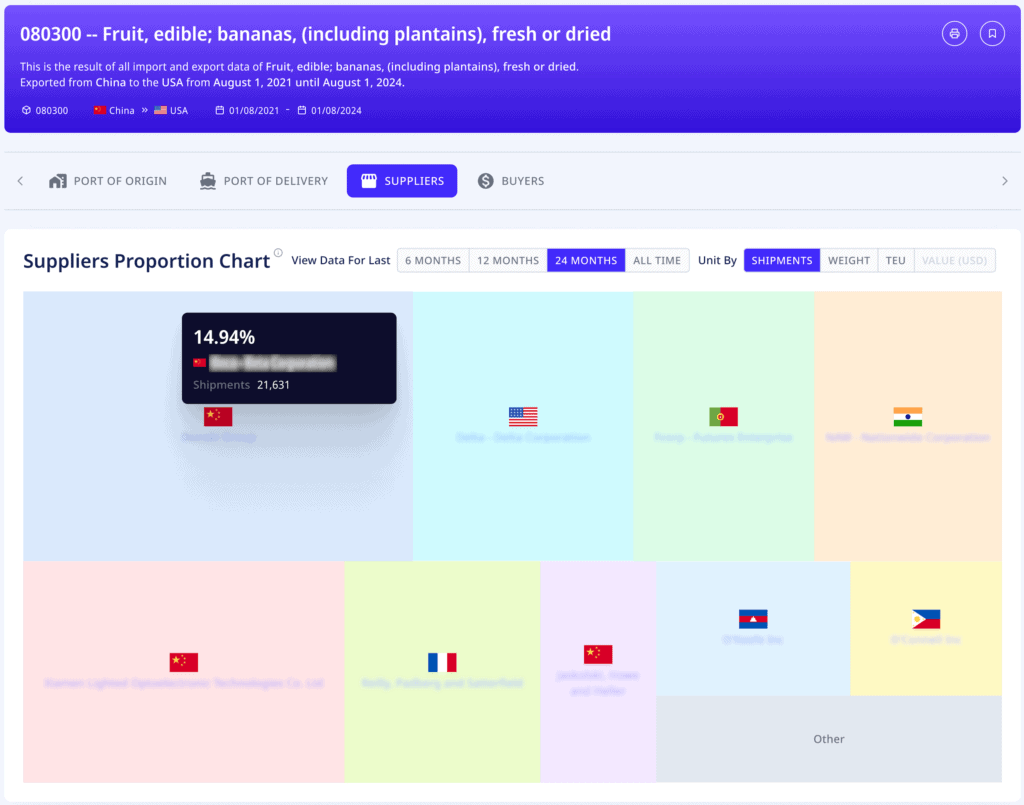
The Suppliers Proportion Chart visually represents the distribution of suppliers in the market. By viewing data for different timeframes, businesses can identify dominant suppliers and their market shares. This feature is crucial for companies looking to source products, as it helps them find reliable suppliers and understand the competitive landscape. Knowing the major players in the market enables businesses to negotiate better deals and establish strong supply chain relationships.
Suppliers Data
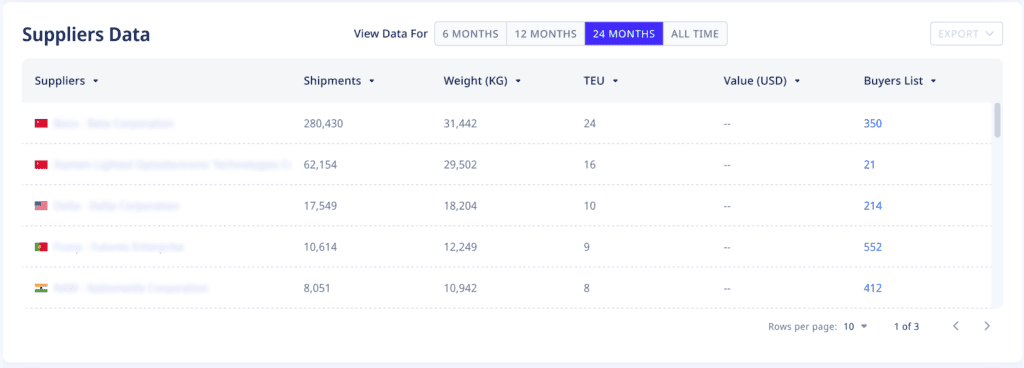
The Suppliers Data table provides detailed information on individual suppliers, including shipment volumes, weights, TEUs, and buyer lists. This granular data allows businesses to assess the performance and reliability of potential suppliers. Companies can identify the top suppliers, understand their capacity, and select partners that align with their procurement needs. This detailed supplier analysis is a unique feature of ADAMftd, giving businesses the confidence to make informed sourcing decisions.
Buyers Proportion Chart
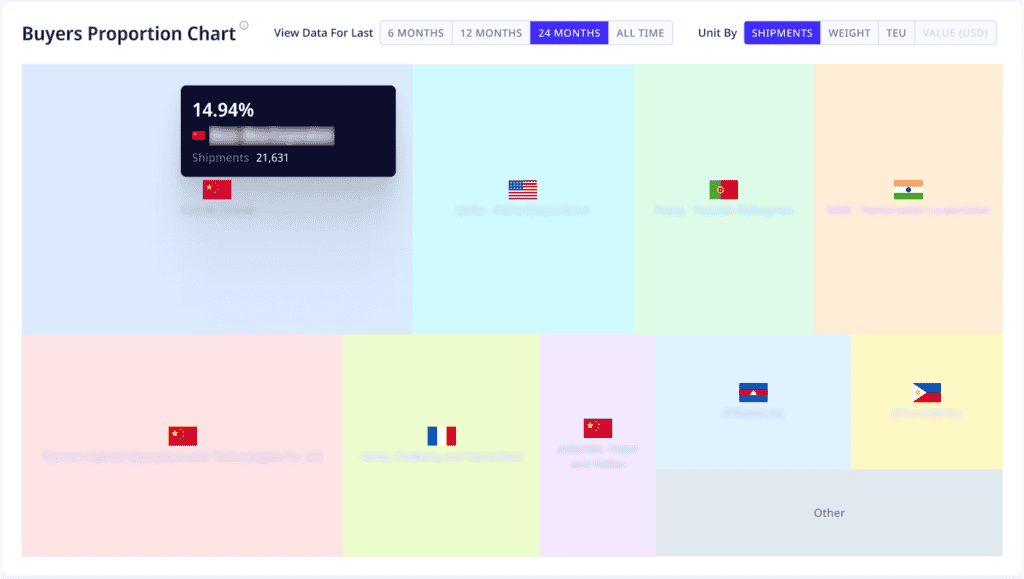
The Buyers Proportion Chart shows the market share of various buyers, helping businesses understand the demand side of the market. By analyzing buyer proportions, companies can identify key buyers and target their sales efforts more effectively. This chart helps sellers pinpoint high-potential customers and tailor their marketing strategies to maximize reach and engagement. Understanding buyer dynamics is essential for expanding market share and driving sales growth.
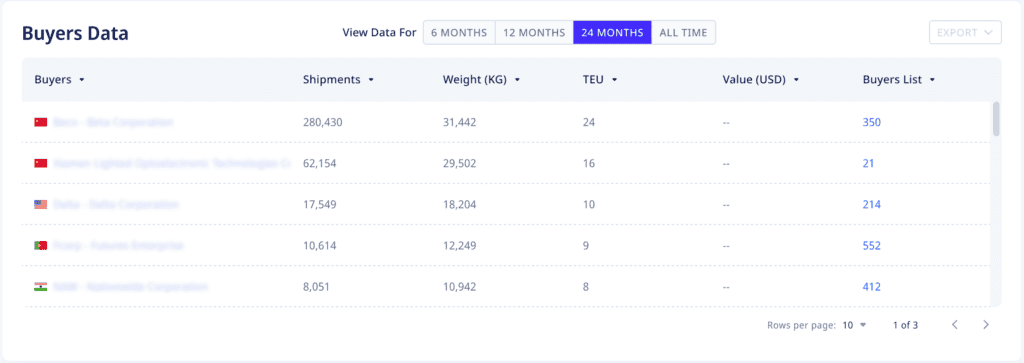
Buyers Data
The Buyers Data table offers a comprehensive view of individual buyers, including shipment volumes, weights, TEUs, and supplier lists. This data is invaluable for businesses looking to expand their customer base. By analyzing buyer data, companies can identify potential customers, understand their purchasing patterns, and tailor their sales pitches to meet specific needs. This level of detail helps businesses build strong customer relationships and secure long-term contracts.
Unique Advantages of ADAMftd
ADAMftd stands out by providing an extensive suite of tools for detailed market analysis. The platform’s ability to offer both broad market trends and specific company insights makes it a powerful tool for businesses. Whether sourcing products or targeting new markets, ADAMftd equips companies with the data they need to make strategic decisions, optimize their supply chains, and gain a competitive edge. With ADAMftd, businesses can navigate the complexities of global trade with confidence and precision.
Product & HS Code Market Analytics Use Cases

Analyzing High-Volume Products
Market analytics by product helps businesses identify top-selling products, measured by shipment volume, weight, and value across select geographies. This information is crucial for prioritizing procurement, production, optimizing inventory, and focusing marketing efforts on the most profitable product lines, enhancing overall business performance.

Evaluating Product Mix
Analyzing the proportion of different products within total global shipments to different geographies or companies allows businesses to understand their product mix and its potential contribution to overall sales. This insight helps in balancing the portfolio, ensuring a diverse range of offerings, and mitigating risks associated with over-reliance on a single product category.

Tracking Changes Over Time
By viewing product data over various time periods, businesses can track changes in product demand and identify emerging trends. This helps in procurement, adjusting production schedules, launching new products, and phasing out declining products, ensuring alignment with market demands.

Geographical Market Analysis
Market analytics by product provides insights into the performance of specific products in different geographical regions. This information is vital for understanding regional preferences, tailoring marketing strategies, and optimizing distribution channels to better serve local markets.

Analyzing Product Value and Pricing Sensitivities
Understanding the value and pricing of each product helps businesses set competitive prices and maximize revenue. Analyzing the value of shipments allows companies to identify high-value products and develop pricing strategies that reflect market conditions and consumer willingness to pay.

